Analytics · Jun – Jul 2026
Employee churn prediction on Google Cloud
Anticipate which employees of an engineering consultancy are at risk of leaving, using 24 months of HR records and Slack messages.
- My role
- Ingestion of external labour-market sources, bronze-layer normalisation, retention KPI catalogue and the gold views feeding the dashboard.
- Team
- Team of 5 · Master's thesis with Quantia Ingeniería y Consultoría
- Outcome
- A reproducible GCP pipeline that processes new data with no manual step, with a retention dashboard in Looker Studio and an interpretable model on Vertex AI.
Context
Quantia is an engineering consultancy whose main asset is technical talent. Its annual review process came too late: it detected flight risk when the employee already had one foot out the door. We received two files covering 24 months of history for 130 employees, a spreadsheet with monthly HR records and a CSV with messages from the corporate Slack channel, and one business question:
Can we anticipate which employees are at risk of leaving before it is too late?
The brief had four blocks: data engineering, visualisation, text analysis and a predictive model. And one final milestone that separated an exercise from a solution: at the end, Quantia would hand over data from a later period and the pipeline had to process it and produce fresh predictions without anyone touching anything.
Problem
HR numbers tell you what happened, not why. The emotional signal lives in text, and text arrives messy, full of jargon and proper names. External context matters too: an unhappy employee is a different risk when the market pays the same than when a competitor offers 20% more.
Answering rigorously required a layered data lake with quality checks and governance, not a notebook.
What I did
- External labour-market sources. Designed and implemented the ingestion of Eurostat and the Adzuna API to benchmark internal salaries against the market by role, and left a local analytics module to explore those series before loading them.
- Bronze layer. Renamed the raw layer to bronze and normalised the names and types of every input column so the rest of the team could work on a stable schema.
- KPI catalogue. Wrote the design document for the exploratory analysis and the HR indicator catalogue: technical definition, business interpretation and actionable threshold for each one.
- Gold views for the dashboard. Built the gold-layer views feeding the retention command centre in Looker Studio, plus the guide to connect and maintain them.
- Integration. Reviewed and merged the machine-learning migration branches into the main repository.
Architecture
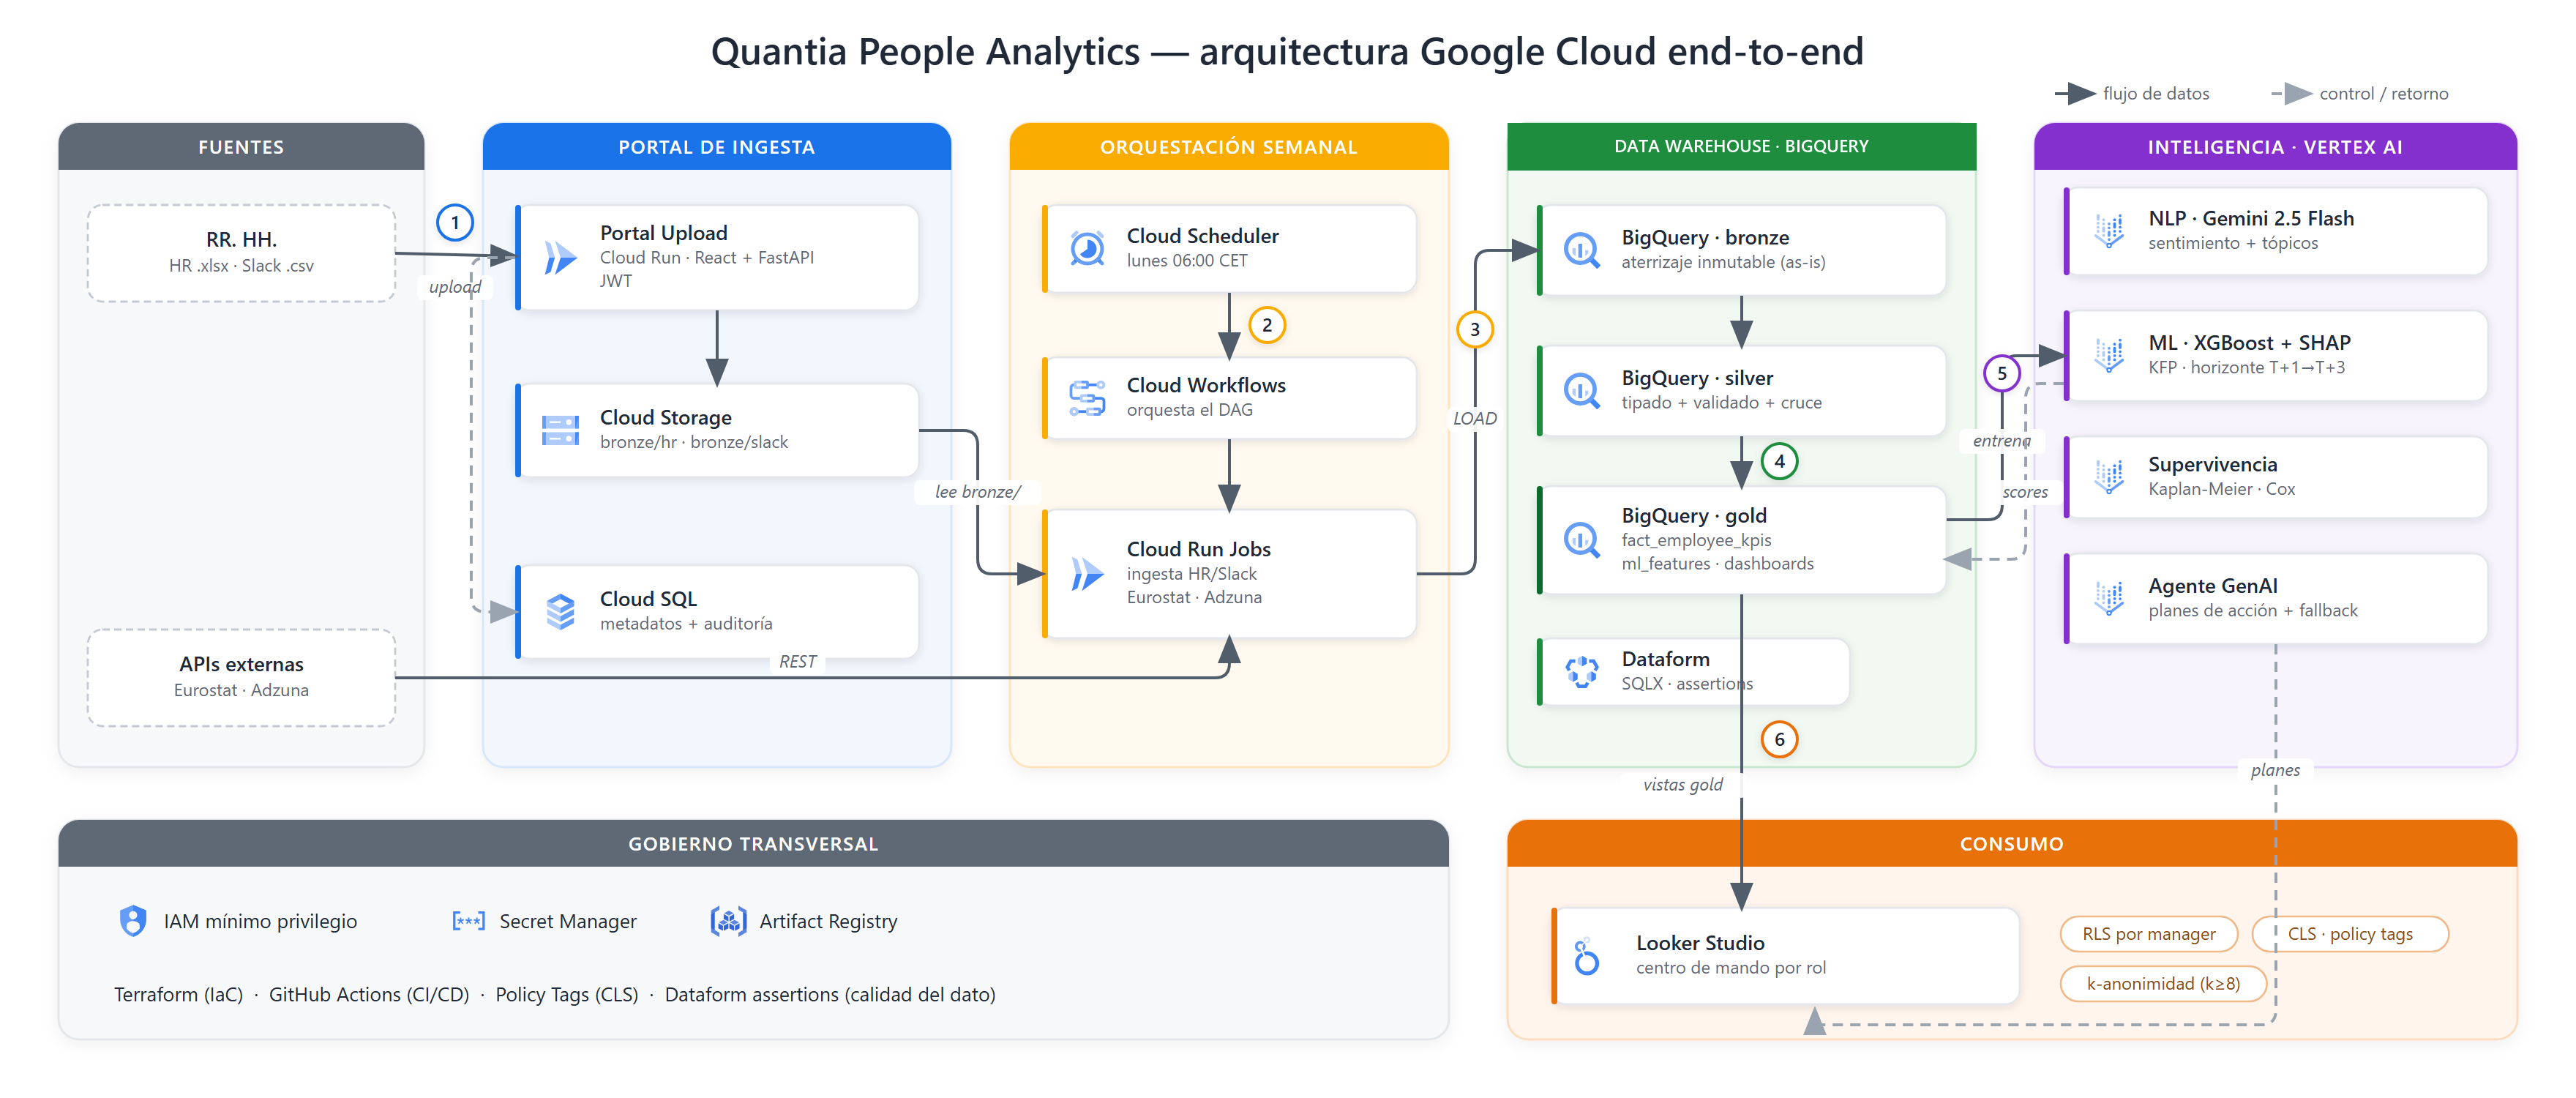
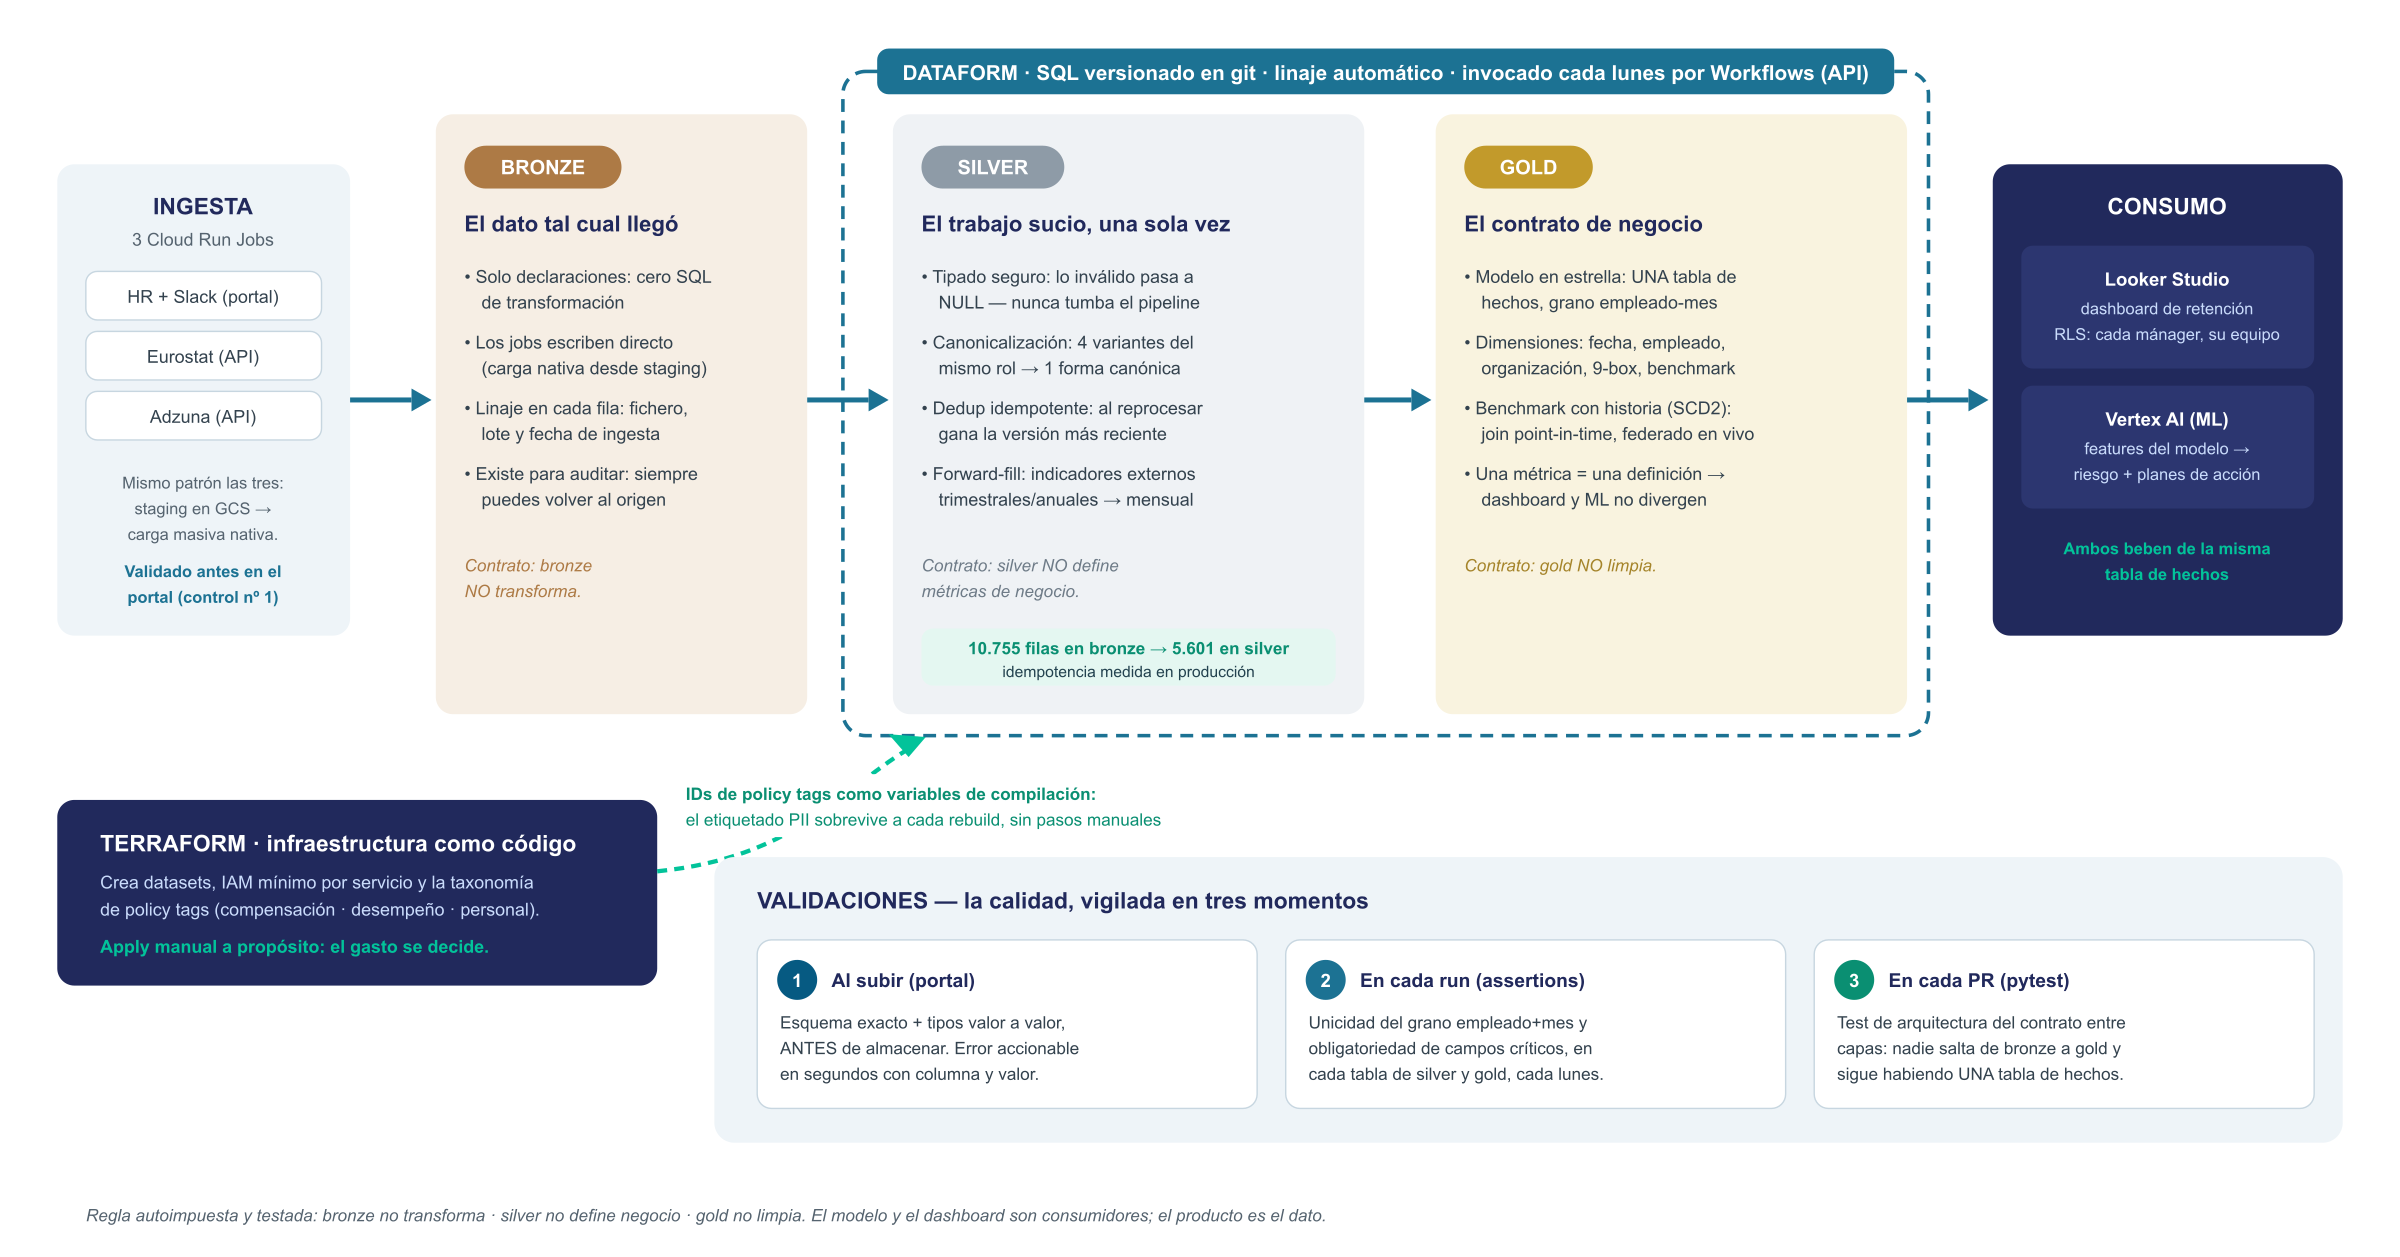
Landing in Cloud Storage, transformations in BigQuery with Dataform following the bronze, silver and gold pattern, quality assertions at every layer and personal-data tags on sensitive columns. On top of gold sit the Looker Studio dashboard and the Vertex AI models: sentiment and topics on Slack, and a churn model with explainability so a manager can understand why an employee is flagged. All infrastructure lives in Terraform, split by environment, and the catalogue in Dataplex.
Outcome
A pipeline that processes the following period’s dataset end to end with no manual intervention, a dashboard with custom KPIs and thresholds, and a model evaluated against acceptance criteria the team fixed in advance. Defended before a panel in July 2026.
What I take with me
The gold layer is a contract with the business, not just another table. When every KPI has a written owner, formula and threshold, meetings stop arguing about numbers and start arguing about decisions.